
Help Center
How can we help?
Everything you need to trade on Kalshi Pro, from your first fill to leverage on perpetuals.
Trade
15-minute markets
Built for markets that settle every 15 minutes: see where the price stands against the target, act from one screen, and roll into the next window without reopening anything.
5 min read · Updated Sep 28, 2026
A 15-minute market opens, trades, and settles in about the time it takes to read this page. The underlying can cross the target several times in one window, and the book reprices every time it does. With so little time on the clock, the seconds you spend switching screens or reopening a market are seconds you’re not trading.
The 15-minute page is built for that pace. Every 15-minute series, like 15-minute Bitcoin, gets one screen with everything you need to decide and act: where the price stands against the target and how long is left, a chart that updates by the second, the live order book, the order panel, and your positions. When a window closes, the next one is already loaded, so you can trade a series window after window without losing your place.
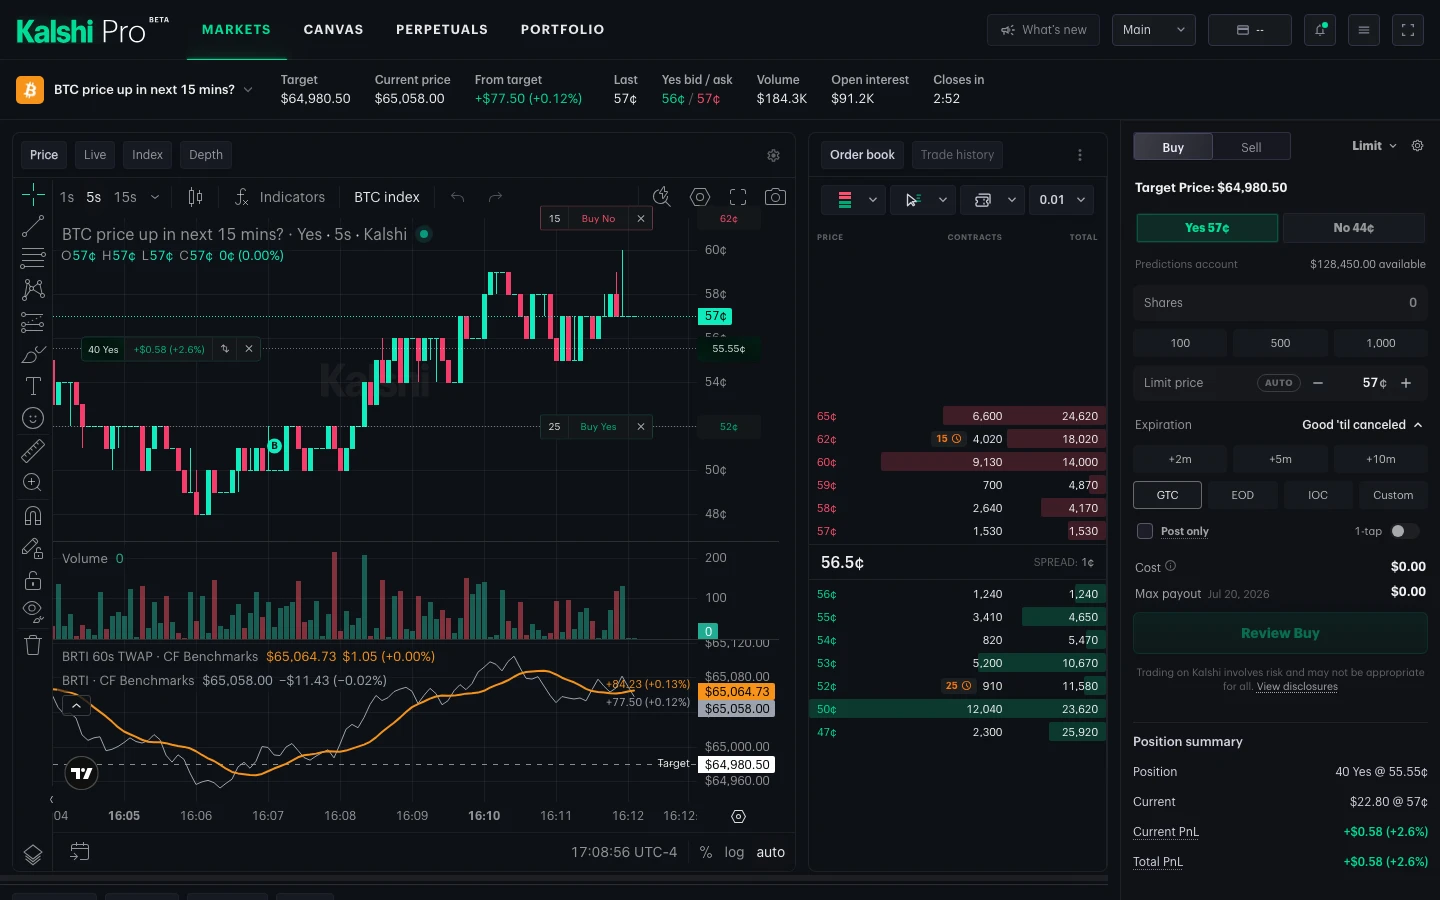
Opening the page
Wherever a 15-minute market appears, look for the Open full page button:
- Markets: on the market’s row, next to its name.
- Trade window: in the header, beside the other actions.
- Canvas: in the tile’s header, shown below.
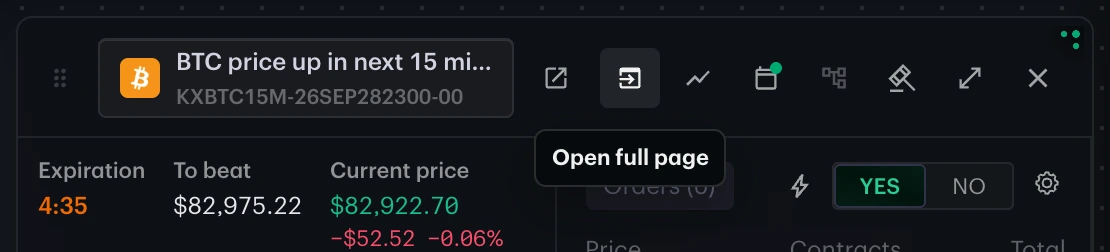
To move to another 15-minute series, click the market name at the top of the page. The picker lists every active series with its target, current price, distance from target, Yes price, spread, and volume, and you can sort any column or search.

It always shows the live market
The page belongs to the series, not to a single market. When the current window closes, the page moves to the next one on its own: the chart, book, order panel, and blotter all switch in place. Your chart interval and indicators carry over; drawings start fresh with each market. The address never changes, so a bookmark always opens whatever is trading now.
When a market you watched live settles, a notification shows the result (for example, “Settled Up”) and, when available, the final price against the target, so you know how the last window went without leaving the next one. The Alerts switch in the notifications menu turns these on or off.
Reviewing a past market
Click an earlier market in the blotter and the page opens it and stays there instead of rolling forward. A banner names the window you’re looking at (“Viewing a past slot · Mon, Sep 22, 4:00 PM ET”); click Go to live market to return to the live market. Sharing the page’s link while you’re on a past market opens that same market for whoever follows it.

Chart views
The chart has four views, one tab apart. Pick one to see it.

1 / 4
Fifteen minutes is a slice of a longer move. Before you trade a window, open Index and step back to hourly or daily candles: whether the target sits at the edge of the day’s range or against a strong trend is context the Price chart alone won’t show you.
Order book and trades
The column beside the chart holds the order book and every trade as it prints. Set it up the way you read the market; Pro remembers your choices.

1 / 4
Clicking a price in the book fills the order panel. Keep side keeps your Buy or Sell selection; Take liquidity buys from an ask and, when you own shares, sells into a bid.
Trading from the chart
Your orders and position are drawn right on the Price chart, and you can trade from them without leaving it. Pick a feature to see it in action.

1 / 5
Turn the lines and marks on or off from the settings (gear) button on the chart.
The blotter
The blotter covers the whole series, so your fills and positions from earlier windows stay put after a rollover. Alongside Positions, Orders, and Fills, a Settled tab lists each closed market, how it resolved, and your payout and realized P&L. Drag the divider above it to trade height between the chart and the blotter; Pro remembers the split.
